English
 简体中文
简体中文
 Tiếng Việt
 Malay
Malay
 Indonesia
 Deutsch
 Français
 Español
 Italiano

Price chart classification
2021-07-05Price chart classification
According to different time period, price chart can be divided into line chart, minute chart, hour chart, daily chart, weekly chart and monthly chart, etc. The chart of different time period has its unique characteristics.
1. Line chart
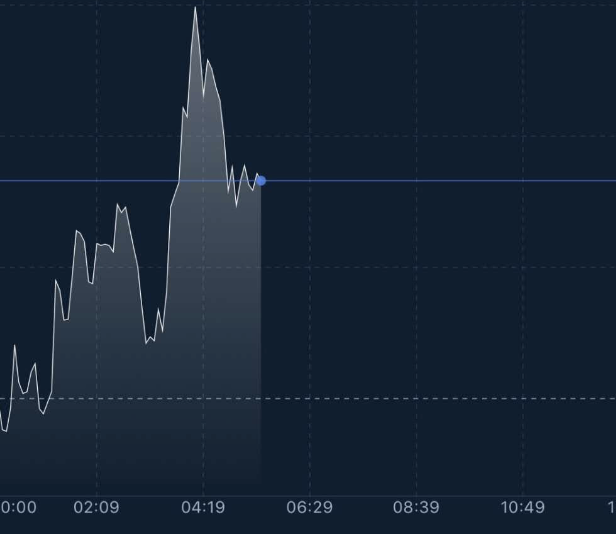
Line chart records the price from time to time, accurately reflects the direction of price fluctuations, and provides support for our short-term trading and real-time order placement.
2. Minute chart
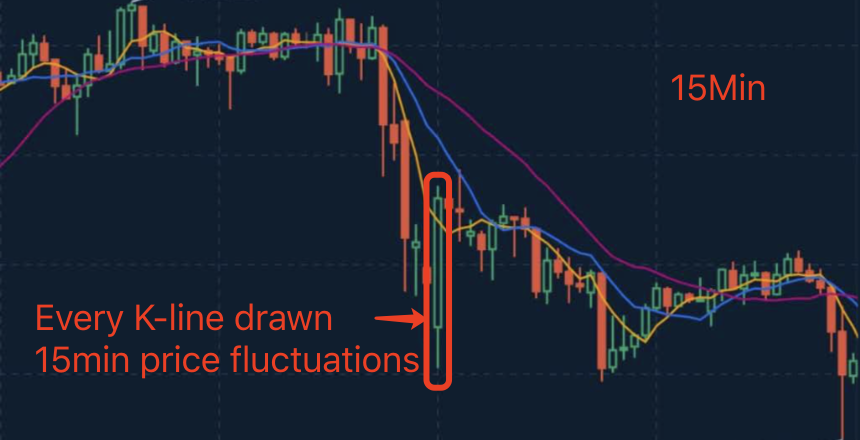
The minute chart refers to the price trend chart formed continuously by the K line of 1 minute/5 minutes/15 minutes or 30 minutes. If you decide to trade intraday, you can use the minute chart. Because of obvious fluctuations of minute chart, there are many opportunities to enter the market. Investors can grasp the timing of intraday trading.
3. Hour chart
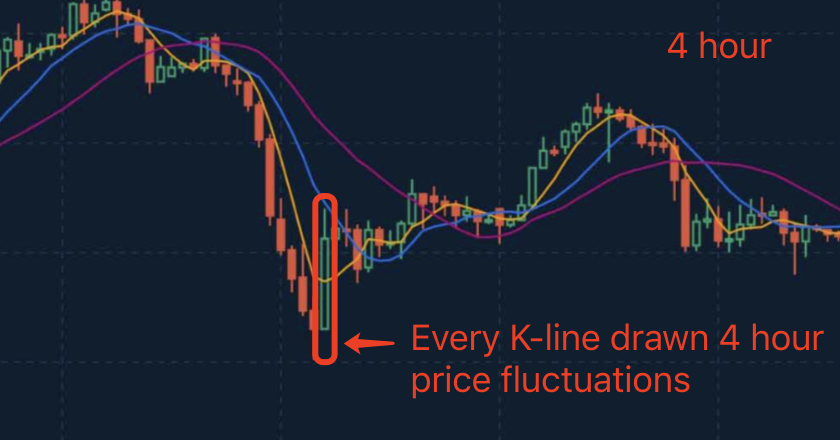
The hour chart refers to calculation period as the commonly 1 hour or 4 hours, and each K-line represents 1 hour or 4 hour of price. It is easy to judge the short-term direction in hour chart and there are more opportunities to enter the market. It is the favorite chart of trend trading investors.
4. Daily chart
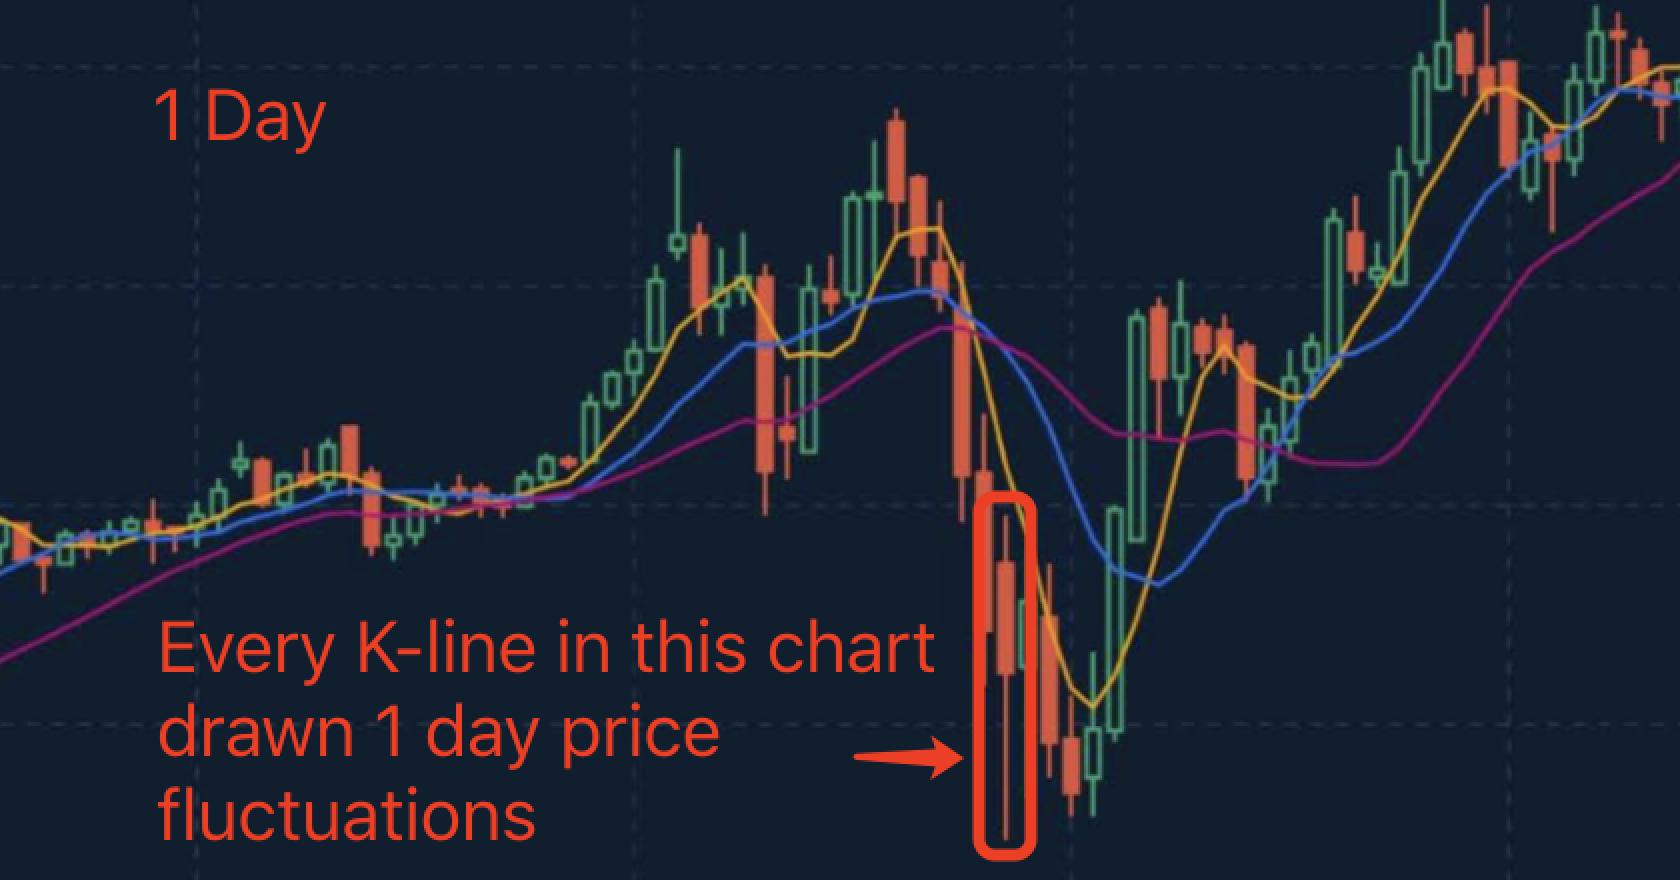
Daily chart is a K-line drawn by selecting a time period of one day, and a continuously formed price trend chart. Each K-line represents a day's price trend. The daily chart is the most used K-line chart, which has the greatest effect on judging the trend direction of the market.
5. Weekly chart
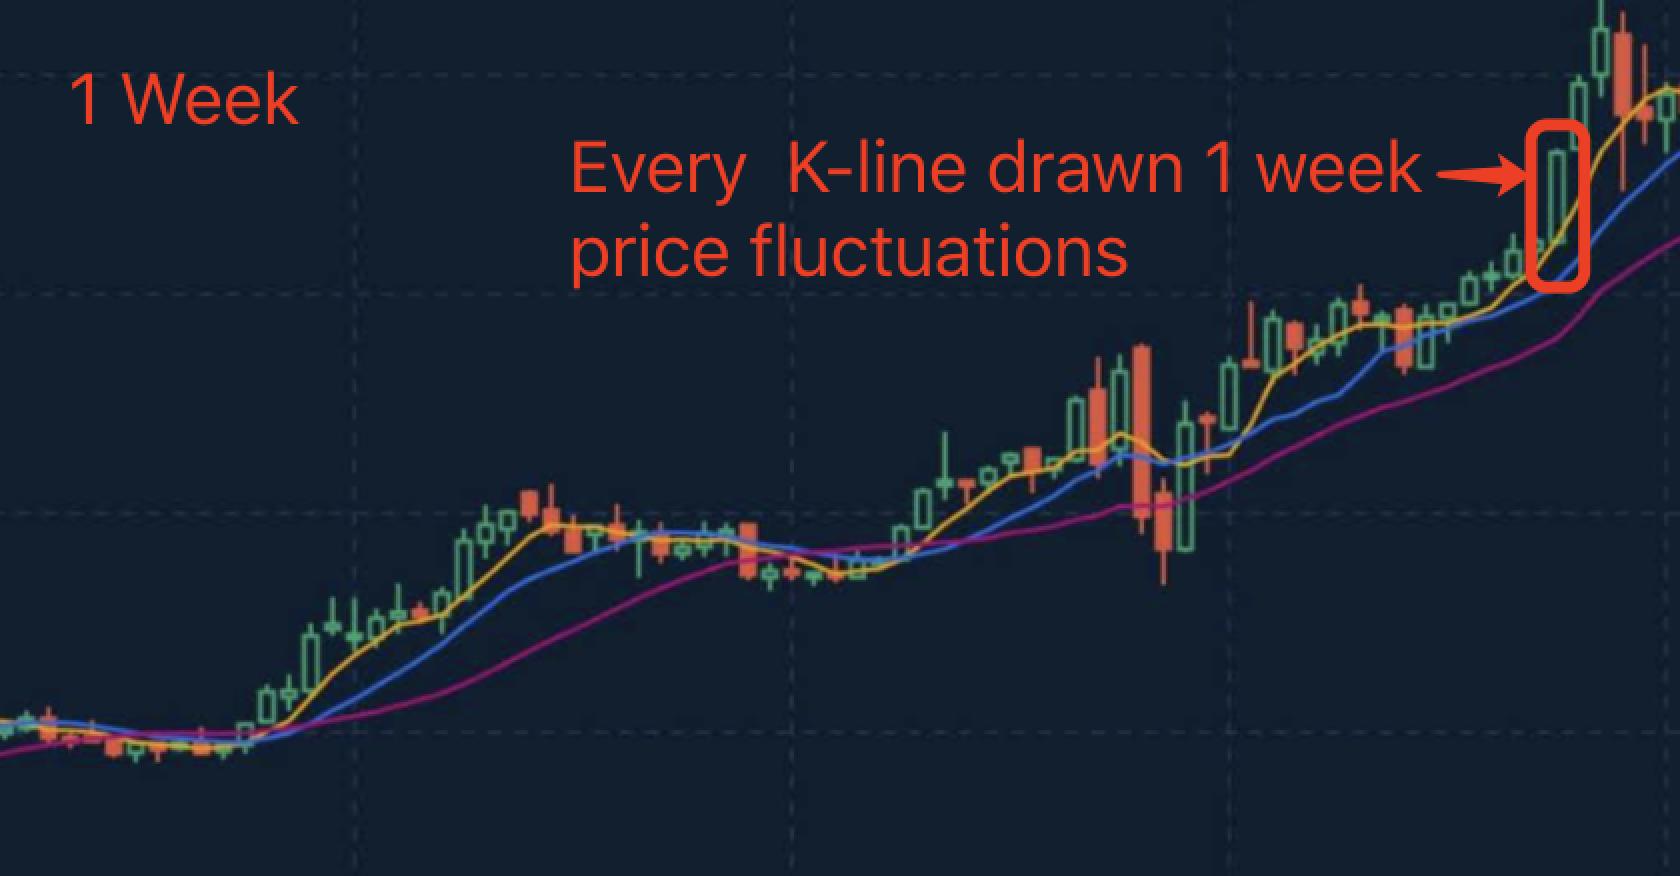
The weekly chart is a live chart formed by selecting 5 trading days from Monday to Friday to be drawn as a weekly chart. Each K-line represents the price trend of 5 trading days. The weekly chart is conducive to studying the mid-term trend.