English
 简体中文
简体中文
 Tiếng Việt
 Malay
Malay
 Indonesia
 Deutsch
 Français
 Español
 Italiano

How to use KDJ in trading?
2021-07-05What is KDJ?
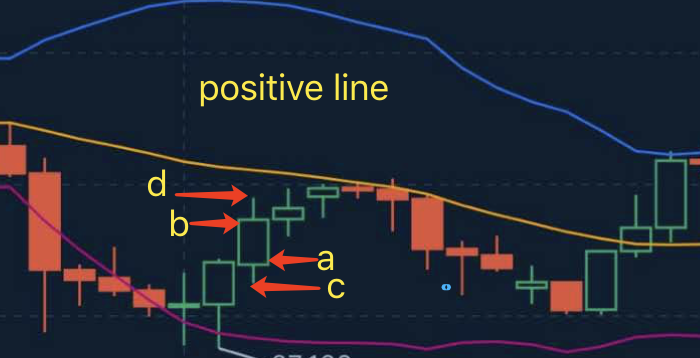
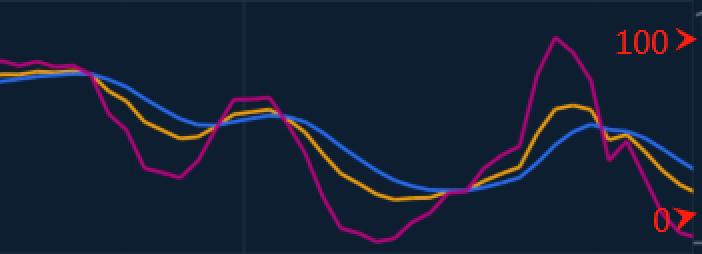
KDJ consists of 3 lines:
faster moving line-K value, slower moving line-D value and confirm line- J value. These three lines move between value 0-100, providing the signals of Buy and Sell in short-term trading.
How to use KDJ in trading?
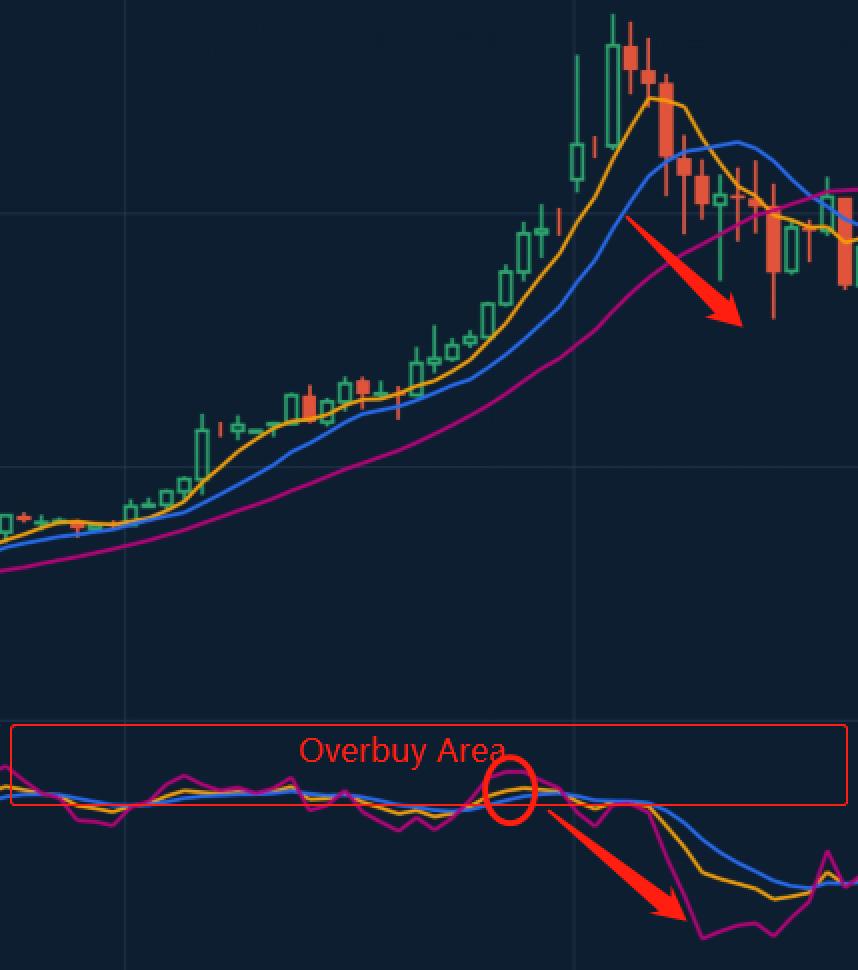
When K value is higher than 90, D value is higher than 80, and J value is higher than 100, it indicates that the price has entered the overbought area. Price increase is weakened, and probably callback. It’s time to close your long positions out. When these three lines are dead cross in overbought area, the price probably falling down. You can enter with short positions.
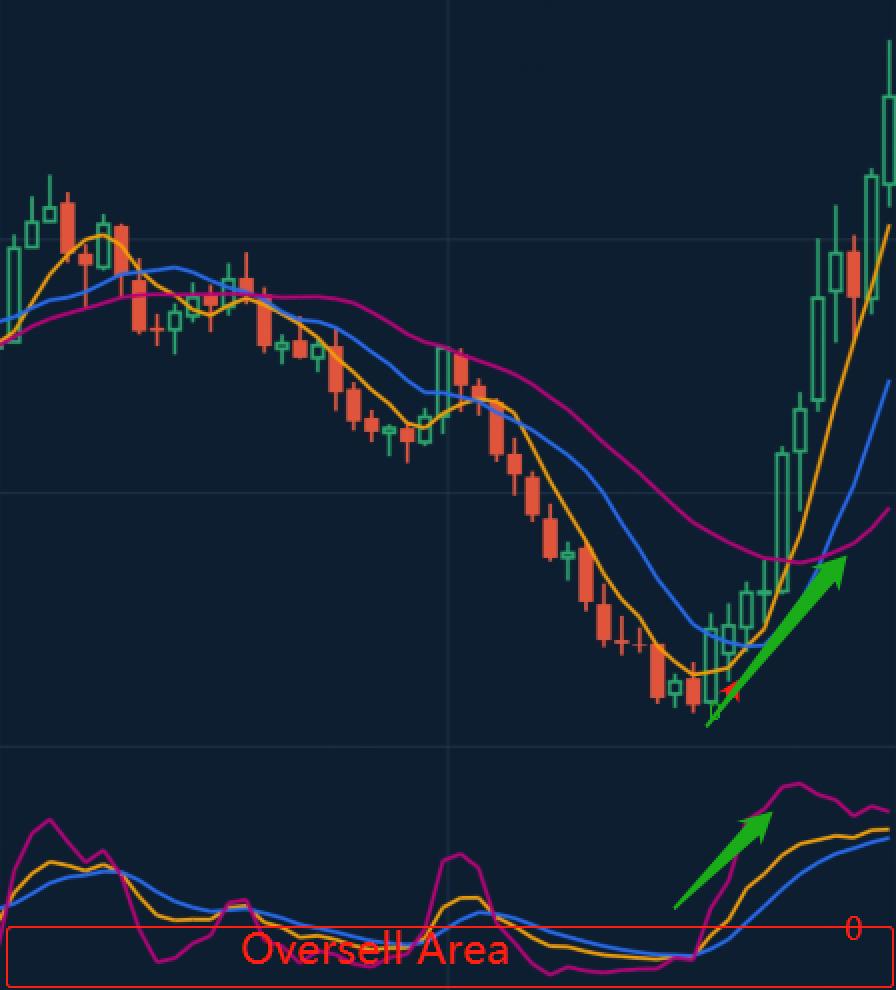
When k value is less than 10, D value is less than 20, and J value is less than 0, it indicates that the price has entered the oversold area. Price decline is weakened, and probably rebound. It’s time to close your short positions out. When these three lines are gold cross in oversold area, the price probably rising up. You can enter with long positions.
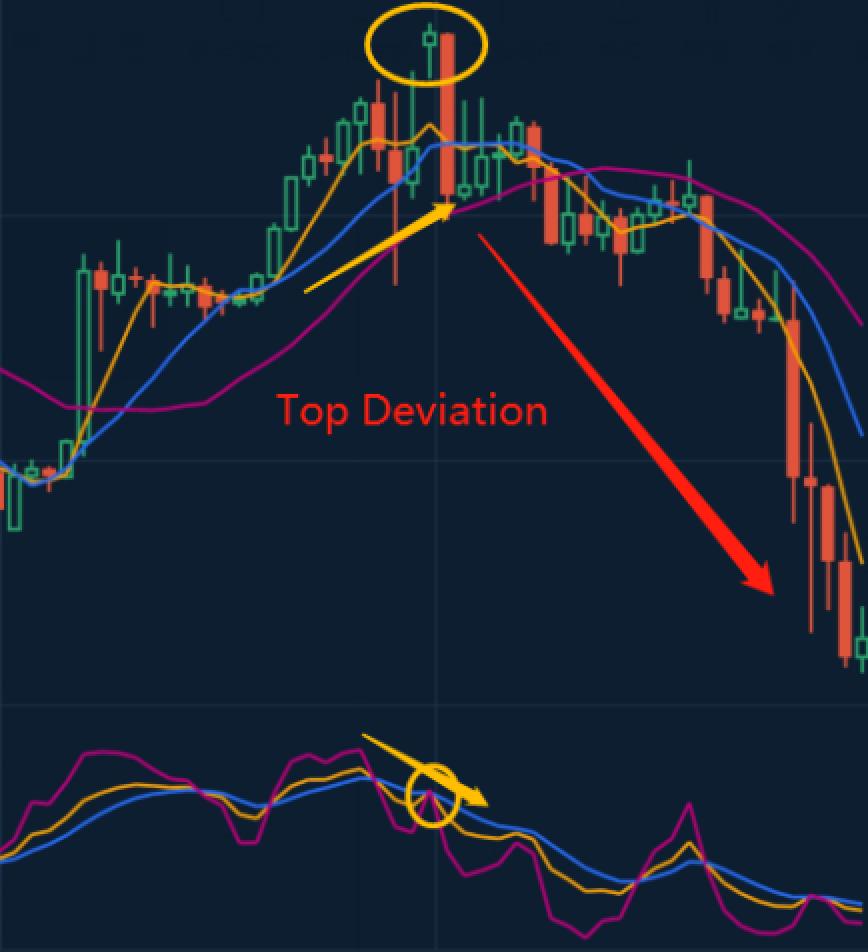
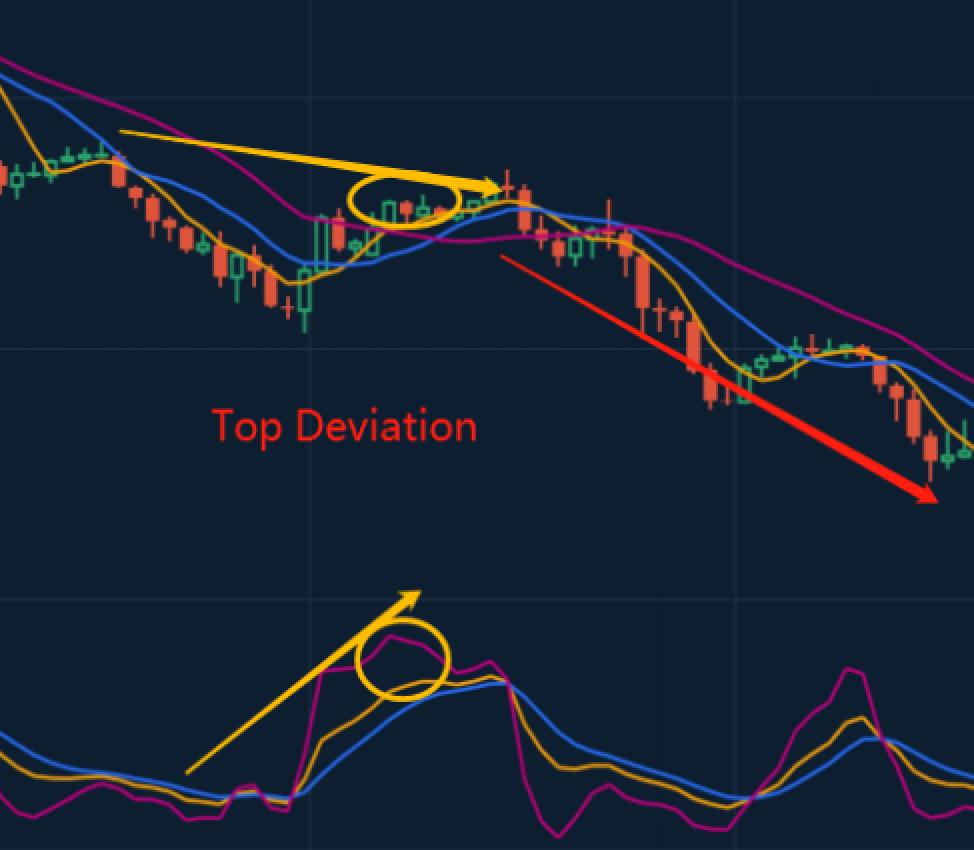
The price is at a new high, while KDJ value is not, it is called top deviation. The uptrend is about to reverse. Long positions would come out and short positions enter in.
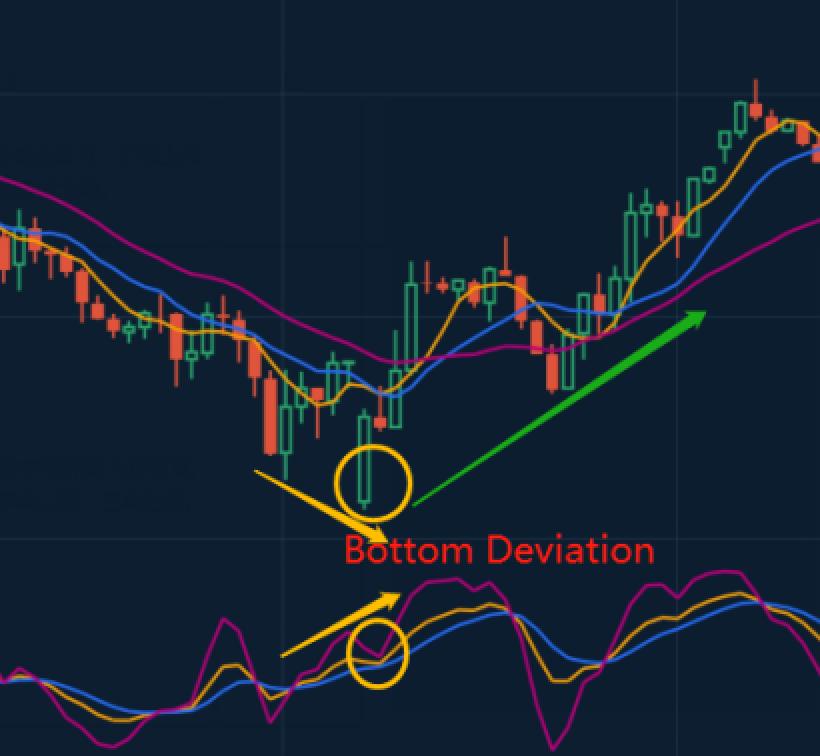
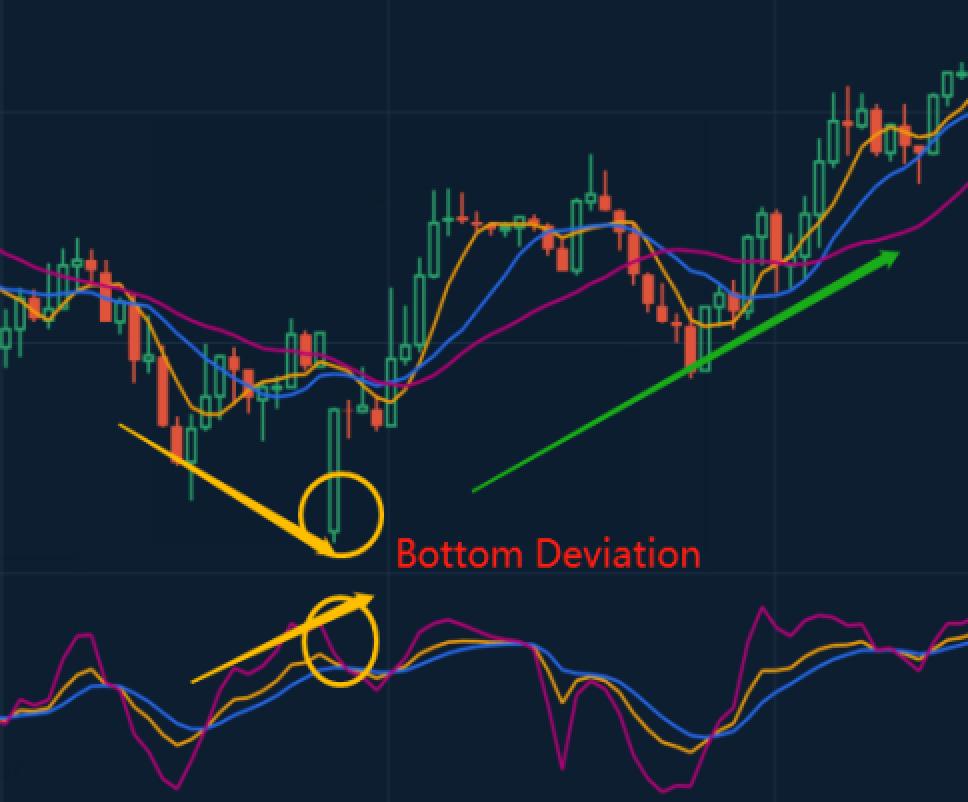
The price is innovative low, while KDJ value is not, it is called bottom deviation. The downtrend is about to reverse. Short positions would come out and long positions enter in.
The price has not reached a new high, while KDJ value did. It is the top deviation and a signal of Sell.
The price has not innovative low, while KDJ value did. It is the bottom deviation and a signal of Buy.
Find out more about indicators in our platform !