 English
 简体中文
简体中文
 Tiếng Việt
 Malay
Malay
 Indonesia
 Deutsch
 Français
 Español
 Italiano
Trade Ideas
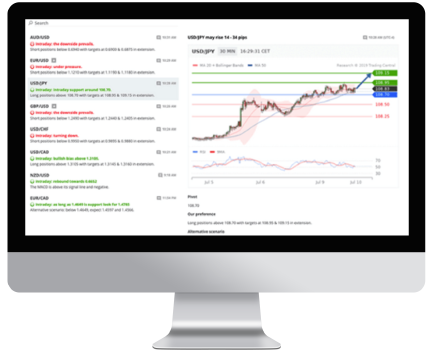
Unique & actionable insights
Trade Ideas is the world’s only financial market research solution offering the unique and invaluable combination of senior analyst expertise and automated algorithms. Our proprietary pattern recognition is constantly monitoring the market to offer you actionable trading plans based on award-winning methodologies. Meanwhile, our global team of expert market technicians are present to validate all analytical output to ensure only the best analysis is published. Trade Ideas becomes your coach and partner in navigating the market.

Supporting you with actionable
top-down research.
All analyses are identified using the proprietary top-down global-macro model created by an award-winning research team. Partnered with our patented pattern recognition technology, Trade Ideas is constantly scanning the market to provide full position management on over 8,000 instruments.
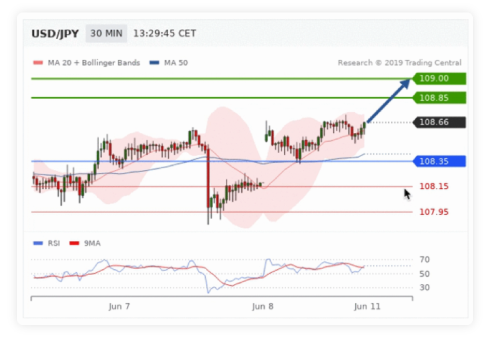
Offering directional insight in the moments that matters.
The clear trend lines, key levels and concise nature of the instrument’s technical scenario enable interpretation of the analysis in a timely manner and act immediately if required.
AWARD-WINNING TECHNICAL ANALYSIS
Engage, Educate & Empower.
For investors looking for their next idea, Trade Ideas software helps traders find the best setups in the market right now. For those who already have an investment idea, Trade Ideas is a repository of professional second opinions.

Views from our senior research analysts

Professional, independent second opinion
The most advanced investing tools
Through a balanced feature set of detailed, proactive analytics, educational guidance and customizable options, Trade Ideas empowers investors of all skill levels to take control of their investments.
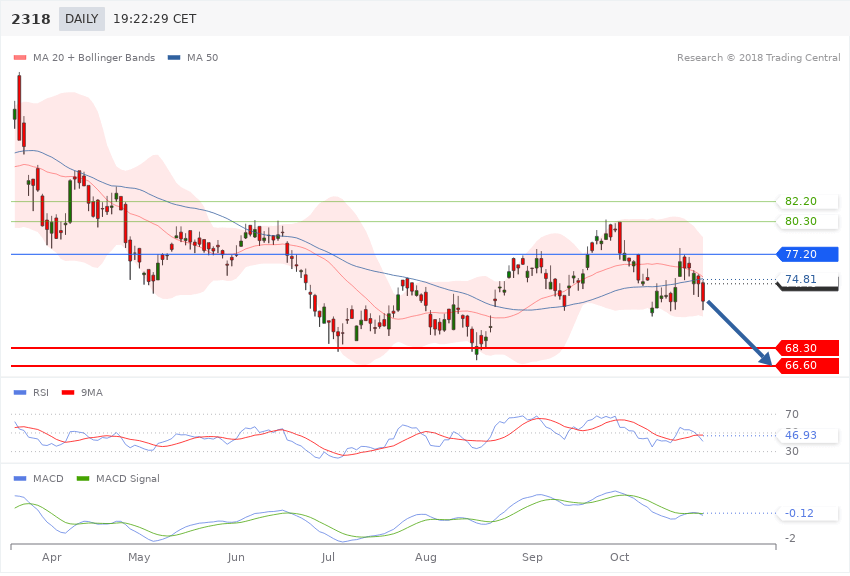
Manage your risk with the clear price targets and pivot line.

The blue stop line marks when a trends has reversed, helping traders manage their risk on an investment.

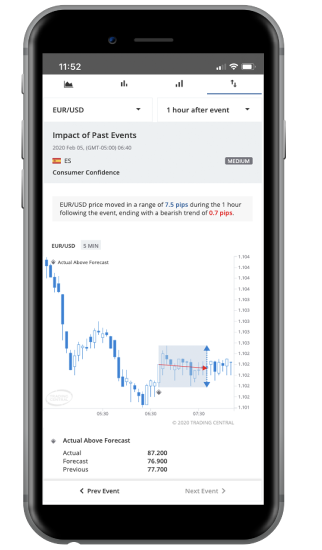
Monitor existing positions or validate a new idea, Trade Ideas easy search feature provides instant access to the most recent analyses!

Beautiful new, modern charts. You won't just enjoy the analysis, you'll love the experience!